The stock market has been on a very strong run since the middle of 2016 with minimal volatility. As most long-term investors have experienced over the years, the market rarely keeps moving up for so long without some type of downward consolidation. I think this naturally begs the question – “when is the next stock market correction?” If we use history as a guide, it seems we are long overdue. This is not a prediction, just a reminder that a healthy stock market never keeps going straight up. The usual pattern as the market expands is typically two steps forward, one step back, and then a repeat, with the general trend being upward over a long period of time.
In fact, if we use history* as a guide, we find that markets generally experience the following frequency on average of pullbacks, corrections and downturns:
| Amount of Decline | How Often? |
| -5% or more | 3 times per year |
| -10% or more | Once per year |
| -15% or more | Once every 2 years |
| -20% or more | Once every 3.5 years |
*Source: Capital Research and Management Group – A History of Declines (1900 – December 2016)
On average is the key wording above. The market volatility data covers every downside occurrence for the last 117 years. As with all averages, the frequency of the market drop may occur more often in some years versus others.
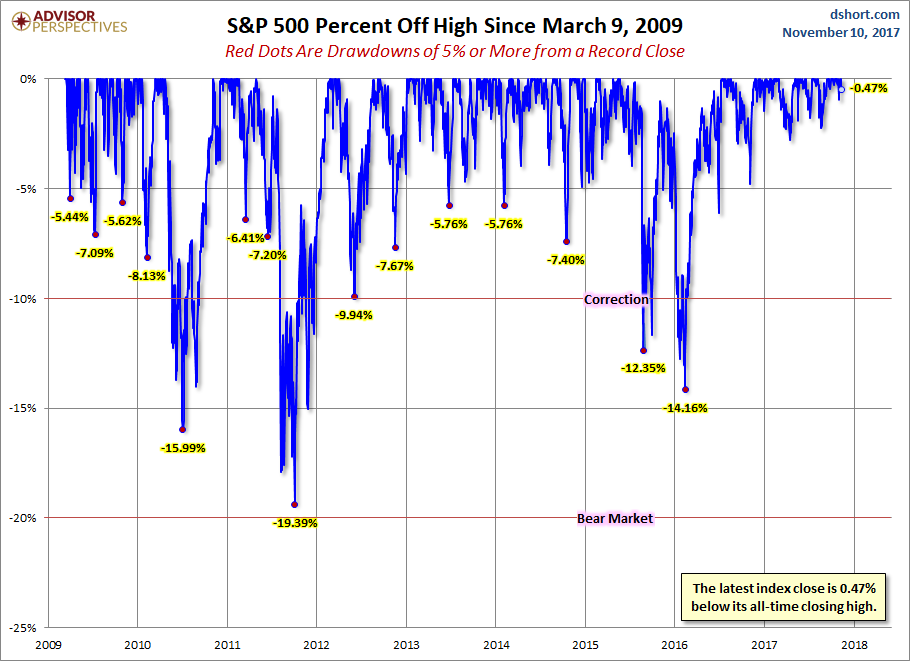
The chart below provides a great visual of recent pullbacks in the S&P 500 since the bottom of the Great Recession as of March 9, 2009. You can see the pullback frequency is similar to the data in the chart above.
In my opinion, one of the best takeaways from the below chart is to recognize, similar to the data above, that 5% to 10% corrections are a healthy part of a normal market expansion. It is not something to be feared, but quite the opposite, it is something to expect and embrace. A healthy market means there is an efficient mix of buyers and sellers. When there are too many buyers, prices tend to heat up too quickly. Thus the normal 5% to 10% pull backs that typically happen one to four times per year is an expected and naturally self-correcting pattern. I think if you really come to understand how common this market correction pattern is, it will help you both sleep better at night and make it easier to ignore all of the negative media headlines that arise when we are working through a normal corrective market process.
Source: www.advisorperspectives.com
Should I be concerned about the current geopolitical situation?
Geopolitics are always a concern for the market, but typically what the market cares most about is corporate earnings. Our portfolios are invested in public securities (stocks) that trade on stock exchanges around the world (via mutual funds and ETFs). The value of those public securities is driven by the level of earnings that each company receives quarterly and annually. Thus as corporate earnings grow, the stock market generally expands. The third quarter of this year was a new record high for corporate earnings. In addition, 3rd quarter GDP was estimated at 3%, after a 2nd quarter GDP of 3.1%, which are both recent highs. In general, I am optimistic on the health of our economy, the overall global economy, and the expected growth to be coming in the near future. If corporate earnings continue to expand, the stock market should likely follow.
This is not to downplay recent media headlines. It is just that there are always geopolitical headlines. Currently the media spotlight is shifting between Saudi Arabia, North Korea, Russia, Iran and Syria. Previous to that it was China, Venezuela, Brazil, Argentina, Iraq, Afghanistan, Greece, the U.K., etc. The point is media headlines are constantly changing, whether it is related to geopolitical events, current events or political issues in the United States. But to repeat again, what the stock market cares most about is corporate earnings. We are not recommending any changes in investment strategy in light of any recent geopolitical or media headlines.
What should we do if the market goes down?
At Wealth Engineering we follow an evidence based investment strategy. We make portfolio decisions, asset allocation decisions and rebalancing moves based on what has worked over numerous decades and that which has a rational explanation as determined by market history and academic research. We don’t make predictions or guesses as to when something may or may not happen.
Following our evidence based investment process, we will design a portfolio for you with a strategic asset allocation as a long-term target. Because our portfolios are globally diversified with a mix of stock funds and bond funds, the normal volatility of 5% to 10% does not typically warrant any special portfolio moves. However, if the volatility were to increase beyond that, we would use our portfolio rebalancing strategy as a guide for ongoing rebalancing needs.
If you become a client that is in the draw down (withdrawal) phase, if stocks are down, bonds are usually up. Thus during our next quarterly rebalance we would likely withdraw funds from the bond side of your portfolio (sell high) to provide ongoing cash for your spending needs. We would do this for a period of time until the stock side recovered.
If you become a client that is in the accumulation phase, any downside volatility presents a good opportunity to “buy the dip.” Thus we would invest any of your excess cash in accordance with your strategic allocation target.
It’s impossible to time the market. However, we can take advantage of any significant volatility by following a disciplined rebalancing process that helps us sell high and buy low regardless if you are in the distribution or accumulation phase.
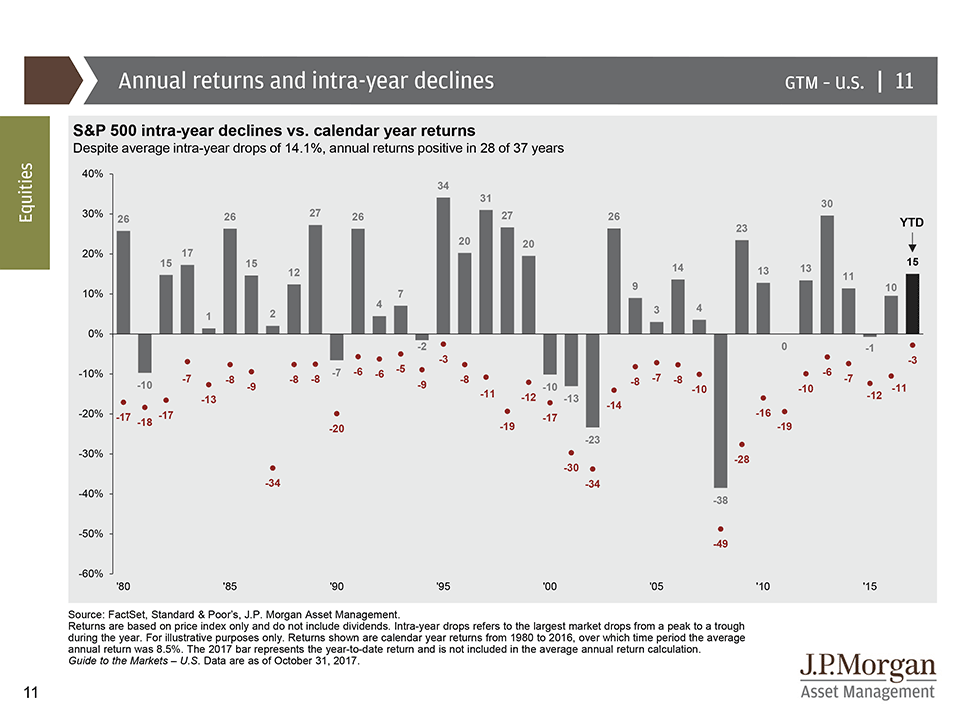
I have one final chart for you below, courtesy of J.P. Morgan Asset Management, which happens to be one of my favorites. It shows the annual return each year for the S&P 500 since 1980, along with the largest amount of drawdown in each respective year (red dot under each bar). The main thing to take away from the chart is (again) that drawdowns are a common occurrence each year. They should be expected as part of the risk bargain you make with a long-term investment in the stock market. Think of risk as a two sided coin. To get the upside enjoyment, you also have to be willing to ride through the temporary pullback that occurs on average one to four times per year.


